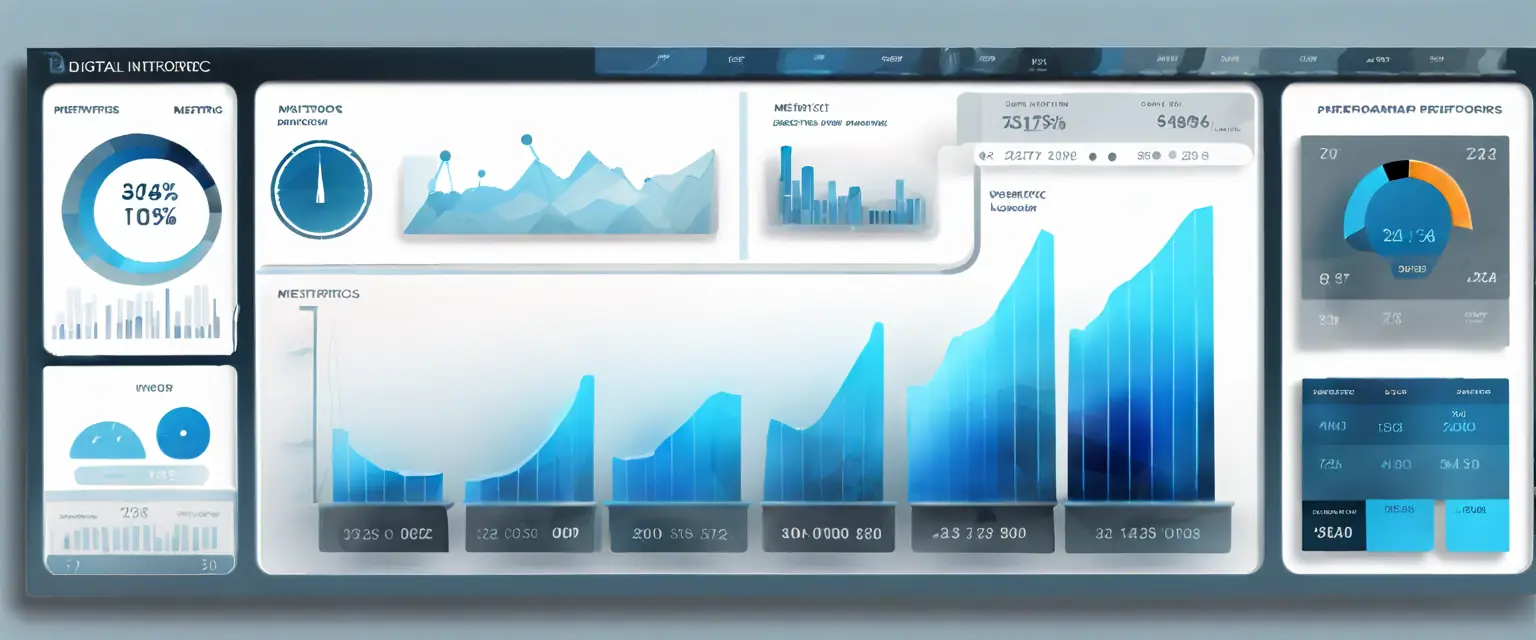
In the realm of data analysis, the ability to visualize information is paramount. Intuitive dashboards serve as powerful tools that help businesses interpret complex data sets at a glance. By presenting key performance indicators (KPIs) in a clear and concise manner, dashboards enable decision-makers to quickly assess their organization’s performance. This visual representation of data not only enhances understanding but also facilitates timely decision-making.
When designing dashboards, it’s essential to focus on user experience. A well-structured dashboard should prioritize the most relevant information while minimizing clutter. Utilizing visual elements such as graphs, charts, and color coding can significantly enhance the readability of the data presented. Additionally, incorporating interactive features allows users to drill down into specific metrics, providing deeper insights without overwhelming them with information.
In conclusion, creating intuitive dashboards is a critical aspect of data visualization. By effectively communicating KPIs, businesses can empower their teams to make informed decisions based on real-time data. As organizations continue to rely on data-driven strategies, the importance of well-designed dashboards will only increase, making them an indispensable tool in the modern business landscape.


